
Photo by Myriam Jessier on Unsplash
How to render charts into images using javascript
How to genrate real-time chart images using javascript
Charts beautify the dashboard ,usually converting data into statistical representation which are easily representable in symbols.
As we go further to dig deeper into dynamic charts we can have real-time charts based on data sets and could also be created with multiple types ie,
Let's start with a basic example of how to render chart in to images with the real-time data,
A. quickchart-js
Quickchart-js is an open api for rendering images or converting them into URLs. chart provides a wide range of chart types , with easy to plugin and use with multiple language support.
Installation
npm i quickchart-js
Types
pie, bar , area, doughnut, bubble, polarArea, progressBar ,etc.
Code
const QuickChart = require('quickchart-js');

const chart = new QuickChart();

// Config can be set as string or as a Javascript object
chart.setConfig(`{
    type: 'bar',
    data: {
      labels: ['a', 'b', 'c', 'd'],
      datasets: [
        {
          label: 'charts',
          data: [3,13,11,19],
         },
      ],
    },
    options: {
      plugins: {
        datalabels: {
          anchor: 'end',
          align: 'top',
        },
      },
    },
  }
  `);

// Print the chart URL
console.log(chart.getUrl());

// Get the image...
const image = chart.toBinary();

// Or write it to a file
chart.toFile(Image.png');
Output
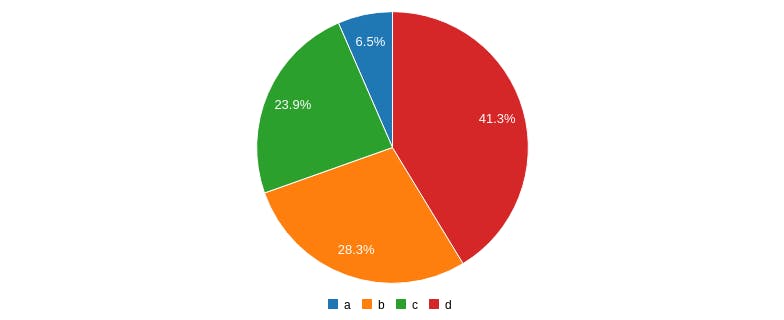
Image.png (Type = Pie chart)
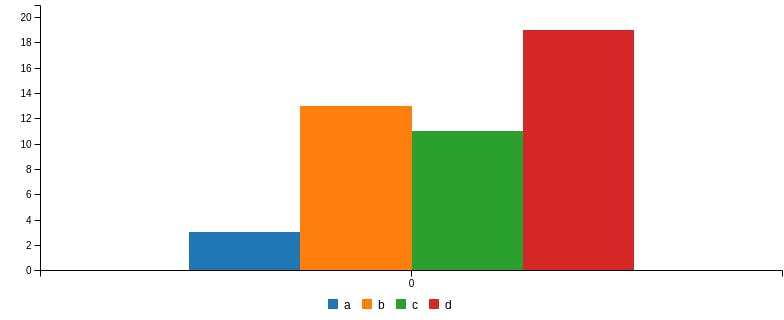
Image.png (Type = Bar chart)
B. c3ChartMaker
c3ChartMaker can be used from the command line or as a code library. It's a great way to render server-side charts.
Installation
npm install --save quickchart-js
Types
pie, bar
Code
const c3ChartMaker = require('c3-chart-maker');
const yourData = [ ]
var ImageName = "Image"
var data = {
    'a': 3,
    'b': 13,
    'c': 11,
    'd': 19
}
const chartDefinition = {
    data: {
        columns: Object.entries(data),
        type: 'pie',
    }
}
const outputFilePath = `${ImageName}.png`;

c3ChartMaker(yourData, chartDefinition, outputFilePath)
    .then(() => {
        console.log(outputFilePath);
    })
    .catch(err => {
        console.error(err);
    });
Output
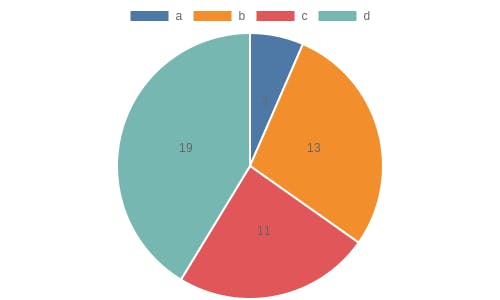
Image.png (Type = Pie chart)
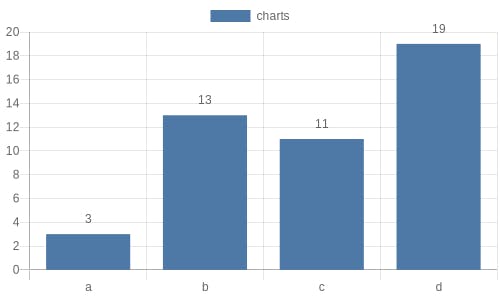
Image.png (Type = Bar chart)
Conclusion :
One can easily convert real-time data to charts and can render it to image , also with quickwork.io one can get URL to image which could be directly added based on data updation.
